As humans, we find visuals highly appealing.
This reflects in our everyday life in various ways.
When we watch a movie instead of reading the book it’s based on or when we scan documents and stop at an image – it’s the visual factor that’s making the call for us.
Our attraction towards visuals plays a big role in content marketing.
Visual content, like infographics, animations, etc. creates more engagement than plain text content.
The power of infographics is such that it can boost your content’s effectiveness and make it easy to grasp.
This article will explore infographics in detail and discuss their benefits, uses, and impact.
In short, everything you need to know about why infographics are an integral part of today’s content marketing strategy.
Table of Content
- What are Infographics?
- Infographics and the Human Brain
- Why Use Infographics: Unlocking Their Advantages
- What are the Different Types of Infographics?
- Infographics and People
- Infographics and User Searches
- Where can I Share Infographics?
- What Makes an Infographic Design Effective?
- Level Up Your Content with Great Infographics
What are Infographics?

The Oxford English Dictionary defines infographics as “a visual representation of information or data”.
The word infographics is a blend of the words “information” and “graphics” and its origin dates back to the 1970s.
Infographics convey complex information in a clear and legible manner.
It uses imagery, like charts, graphs, etc. and minimum text to share information engagingly.
For conveying data-rich information, infographics are the best choice.
It helps retain user attention and makes it easy for users to read and remember content.
For example, when providing a record of statistics on a topic, infographics will be clearer, quicker to grasp, and more memorable than long-form text content, which may seem overwhelming.
Infographics and the Human Brain
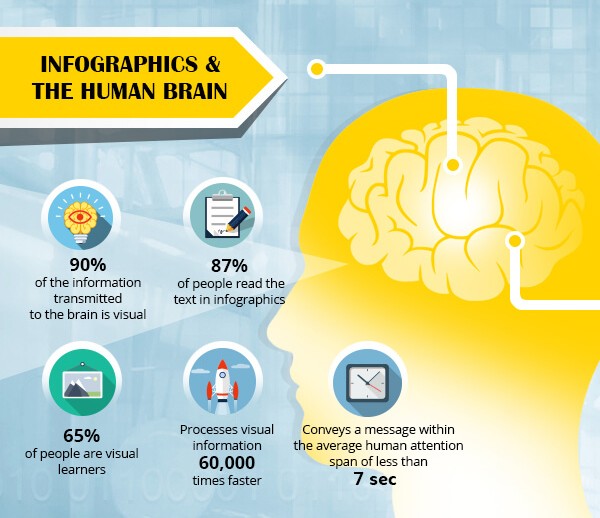
Humans are visual creatures.
90% of the information that is transmitted to our brains is in visual form.
In fact, our brains can process visual information 60,000 times faster than text.
The ease with which our brains comprehend visual information plays an active role in why we get attracted to visuals.
It is said that 65% of people are visual learners.
A major reason for this is that people connect with visual information in less than 13 milliseconds.
That is, visuals convey messages to readers within the average human attention span of 7 seconds making it easy for them to learn information.
Infographics make text readable by keeping them short and combining them with graphics.
Such crisp and to-the-point texts are read by more than 87% of people.
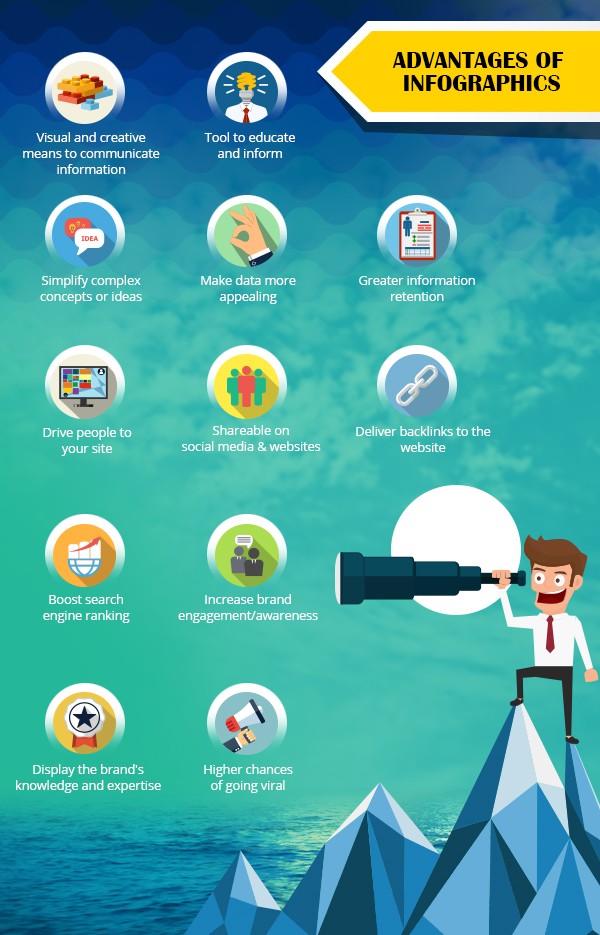
Why Use Infographics: Unlocking Their Advantages
People love credible information.
But at the same time, a lot of information overwhelms them.
Infographics offer the perfect balance by conveying information precisely and attractively.
Some advantages of infographics are:
Visual communication: Visual communication is more effective and interactive. It also adds a creativity layer bringing a fresh touch to information presentation.
Informative: Infographics summarize the essence and thus provide an information-packed visual, simplifying the process of educating and informing.
Simplicity: Effective infographics break down complex concepts into simple and understandable information with the use of visuals and short texts.
Appealing: Visuals are more appealing and persuasive to the human brain. They provide quick insights and have the power to hold human attention.
Memorable: People remember what they see rather than what they read. Infographic content is easier to remember as compared to a whitepaper or eBook content.
Drive website traffic: Infographics have higher chances of getting noticed and hence can attract more people to your website.
Shareable: Compared to other content types, visual content is 40 times more likely to be shared. Sharing on social media will greatly increase your business’s visibility.
Supports link building: Link building is a top SEO strategy that can increase a website ranking. Compelling infographics with credible data will drive people to link to your website which will benefit your organic search traffic.
Boost SEO ranking: Images make content more appealing, increasing the page dwell time and reducing bounce rates. It also helps deliver quality backlinks–all of which increases SEO ranking.
Brand awareness: Infographics contain brand logos, business information and are often prepared in a color palette matching with the brand theme. Thus it improves brand awareness.
Prove expertise: By conducting your own research and collecting fresh data, you can create infographics that are unique and prove your expertise.
Viral content: Being eye-catching and easily shareable, infographics have a large chance of going viral on social media.
Here is an infographic that we created to show the power of infographics.
What are the Different Types of Infographics?
Depending on the type of information you want to convey through your infographic and your goal, you can choose from different infographic styles. The commonly used types are:
Statistical: Includes charts, graphs, icons, and numbers to present facts and figures and convey dense information effectively.
Informational: Used to provide an overview of topics, introduce a concept, or make articles engaging, informational infographics mostly contain text with descriptive headings and relevant illustrations.
Timeline: If you want to convey something in chronological order, be it your brand story, project timeline, or product development history, timeline infographics can be used.
Comparison: For comparing multiple objects, concepts, etc. and identifying the similarities, differences, pros, and cons of each, a comparison infographic is the best option.
Process: To provide a step-by-step summary or a breakdown of a complex process, this type is the best. It uses a color theme and directional elements like arrows, lines, etc. to create an easy to follow process breakdown.
Geographic: For conveying demographic data or location-based data, a geographic/map infographic is a suitable choice. It contains maps to illustrate trends and also use icons and labels.
Hierarchical: To organize information in a hierarchy according to different levels, such as priority, difficulty, etc. hierarchical infographics can be used. It could either be a pyramid chart or an organizational flow chart.
List: To share productivity tips, examples, or a list of resources, this infographic is mostly used. They contain numbered points, eye-catching colors, and small icons to make the content stand out.
Resume: Resume infographics are used by job seekers to get their job applications noticed and help them catch the eye of recruiters.
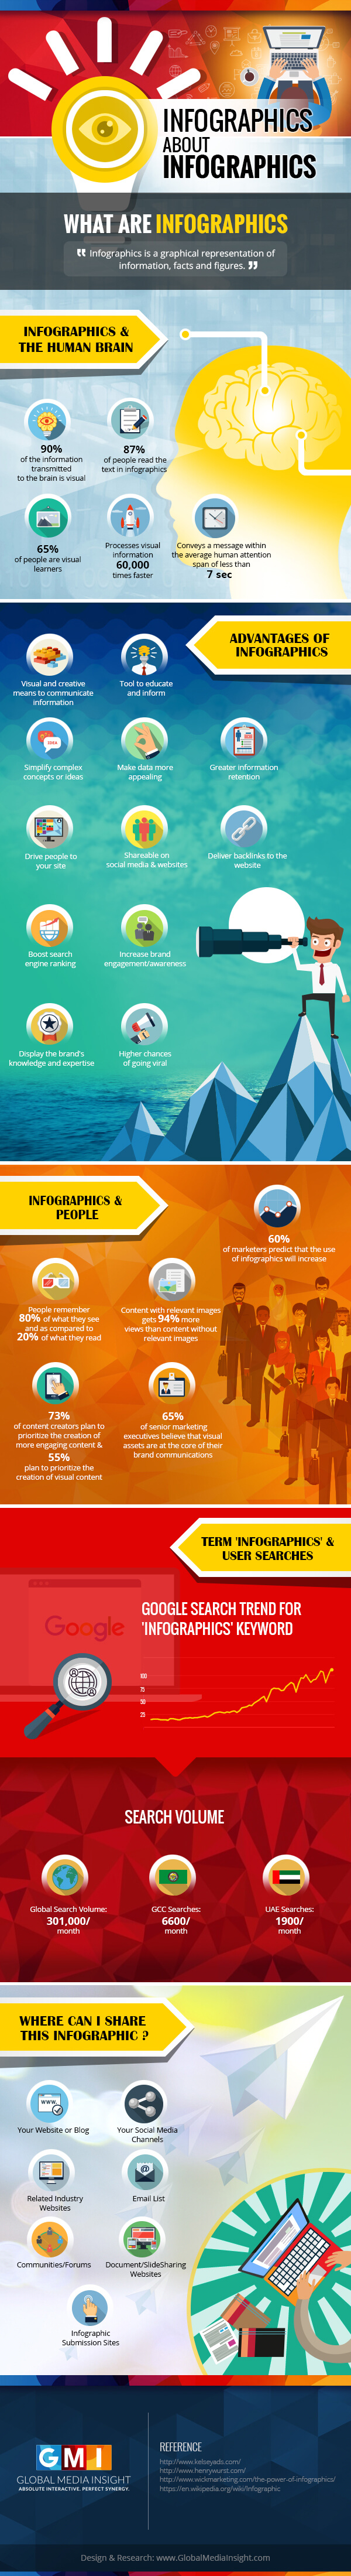
Infographics and People
Content creation is a key marketing strategy today.
Compelling content can make your business stand out and attract people to it.
Infographics have proven to be a popular content format in recent years.
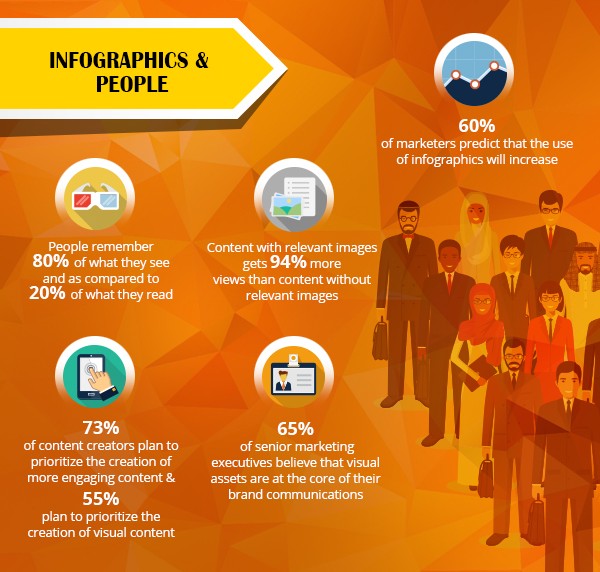
73% of content creators plan to prioritize the creation of more engaging content and 55% plan to prioritize the creation of visual content.
Given how content with relevant images gets 94% more views than content without images, focusing on visual content will be hugely beneficial in the years to come.
It is said that people remember 80% of what they see compared to 20% of what they read.
The marketing industry is also upholding the importance of infographics with 60% of marketers predicting that the use of infographics will increase.
More than 65% of senior marketing executives believe visual assets are the core of their brand communications.
Infographics and User Searches
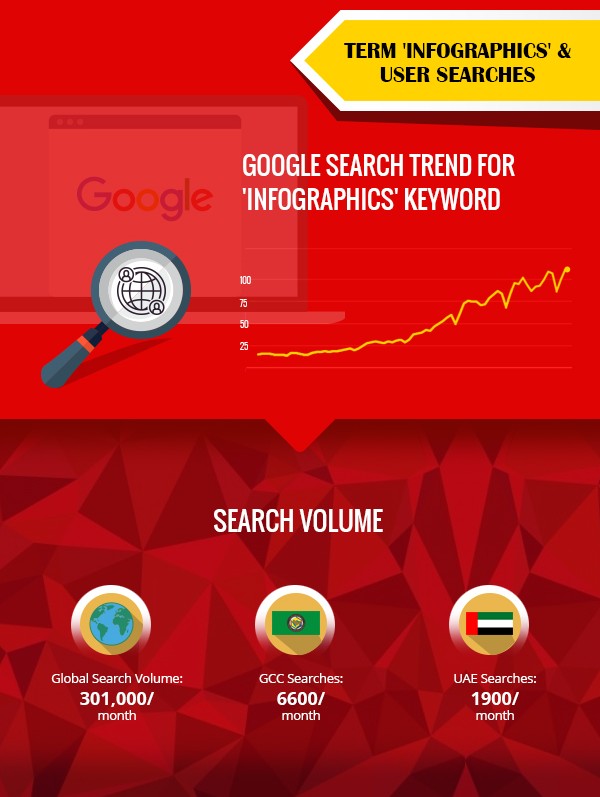
The Google search trend for the keyword “infographics” has increased exponentially over the years.
The global search volume for the “infographics” keyword is 301,000 per month.
In GCC the keyword has a search volume of 6,600 per month and in the UAE, the search volume is 1,900 per month.
Where can I Share Infographics?
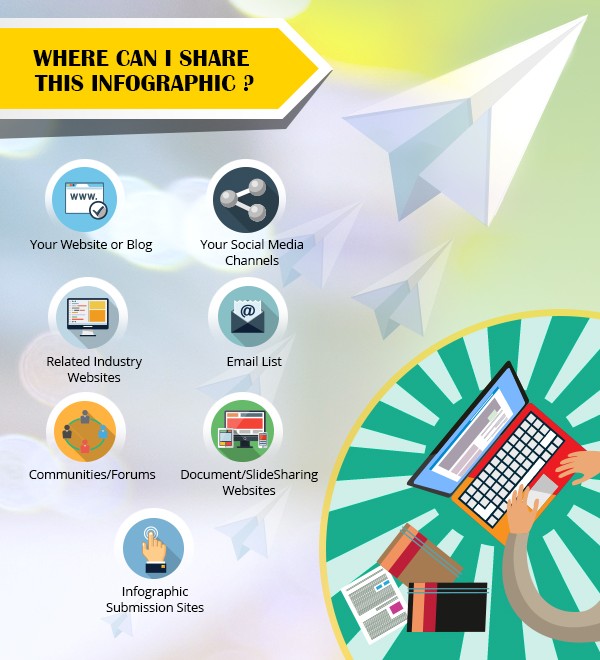
Infographics are commonly shared on websites and blogs.
It helps to improve the understandability of the content and also adds a visual factor to make the content more engaging.
Apart from that, it can also be shared on social media channels and related industry websites to catch the attention of the relevant users.
Another effective way to use infographics is on email lists.
This will make your email compelling and encourage people to take action.
Infographics can also be shared on communities/forums and document/slide sharing websites.
This will increase the reach of your content and drive more people to your website.
Moreover, there are infographics submission sites where you can share your infographic and get noticed.
What Makes an Infographic Design Effective?
When done right, an infographic is a great resource for all types of businesses.
Depending on the goal you want to achieve with your infographic, you can choose the suitable type and curate compelling content.
Five things make an infographic design effective. They are:
Relevant story: Every infographic must have a story that it intends to convey. The story should focus on delivering a central message, should be relevant to your target audience and your business, and also should have a purpose.
Credible data: Data is a core component of infographics. So, it is essential that for an infographic to be effective, the data should be credible, accurate and from reliable sources.
Gripping copy: To present the story and data meaningfully to the readers, a compelling copy is required. The copy should have gripping headers, must be short, simple, and engaging.
Catchy design: The design depends on the story of your infographic. The colors, fonts, icons, etc. should be in line with the theme of the story.
Appropriate visuals: Visuals can be of many types such as graphs, charts, illustrations, human faces – it all depends on your infographic type. You should choose visuals that are suitable for the infographic and help to convey the message better.
Level Up Your Content with Great Infographics
An infographic can make any content go from boring to engaging.
The statistics we discussed make clear the association between the human brain and visual content.
It proves that visual content will never “go out of style” because humans will always find it attractive.
Infographics are so powerful and can really play an integral role in your content marketing.
We, at Global Media Insight, love infographics and use them to make our blog posts and website content more engaging. Our creative team of designers are the best at producing compelling infographics. We offer corporate presentation, video presentation services to our customers. Want to know more? Leave us a message!


Pingback: How to Level Up Your Content Marketing With Infographics – PinnacleCart - Guru of Marketing