As more and more successful companies enter the data-driven digital growth phase, metrics that measure how visitors interact with a website and how many visitors interact with a website are gaining importance as a KPI or a measurement of the success of a brand website.
Tools like Google Analytics can help measure these attributes. In this blog, we will focus on two prominent metrics associated with web analytics: average time-on-page and average session duration. We will discuss what they mean, how they are measured, and the kind of information they can provide about a website’s performance. To begin with, let’s start by defining the terms “time-on-page” and “session-duration.”
TIME ON PAGE
The time-on-page for a web page is calculated by the time difference between the point when a person lands on the page and when they move on to the next one. Clicking a link to another page on the website is the trigger that causes the time spent on the previous page to be calculated. If the person exits the website without going to any other page, then the time-on-page is zero.
SESSION DURATION
Session duration is defined as the time frame during which there are regular active interactions occurring between a user on a website. The session is timed out when there is no activity from the user for a predefined time duration (30 minutes by default). Session duration takes into account the entire time that a person spends on a website. It is effectively the sum of the time-on-page for the different pages that a person visits on a website during a single session. The time-on-page for the last page, from where the visitor exits, will be zero.
Where to find Average Session Duration in Google Analytics?
You can find your website’s average session duration in some of the reports in GA that are related to how users view your website and pages, such as:
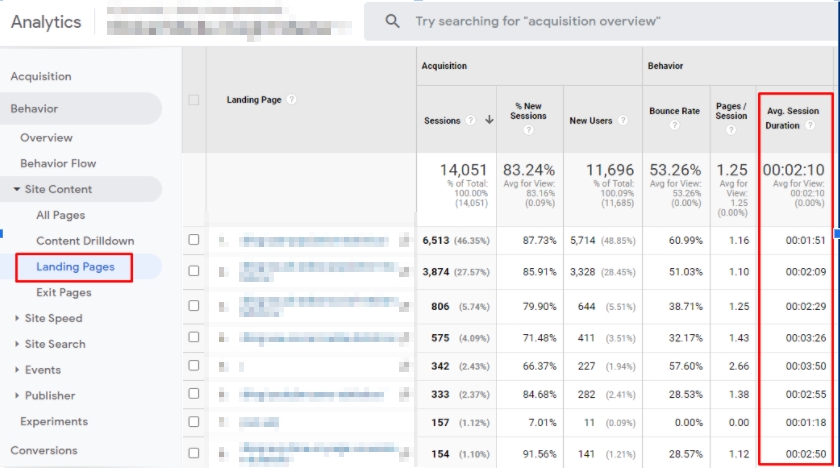
- Landing page report
Behavior > Site Content > Landing Pages report, which shows Avg. Session Duration of each landing page based on google analytics session metrics.
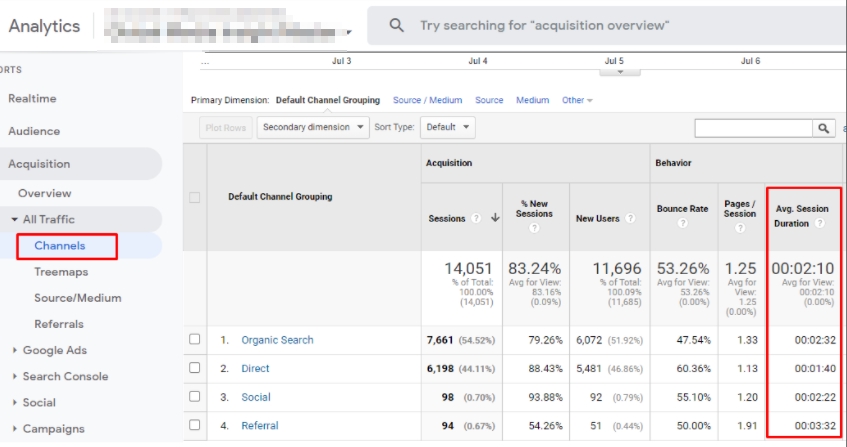
- Channels Report
Acquisition –> All Traffic –> Channels Report, shows Avg. Session Duration of each channel.
Those mentioned above are a few examples. Other than these reports, you can see the metrics Avg. Session Duration in Audience Overview report, Mobile report, Demographics report, Geo reports, etc.
Where can you find the Average Time on a Page in Google Analytics?
You can find your website’s average time on the page in a few reports, like
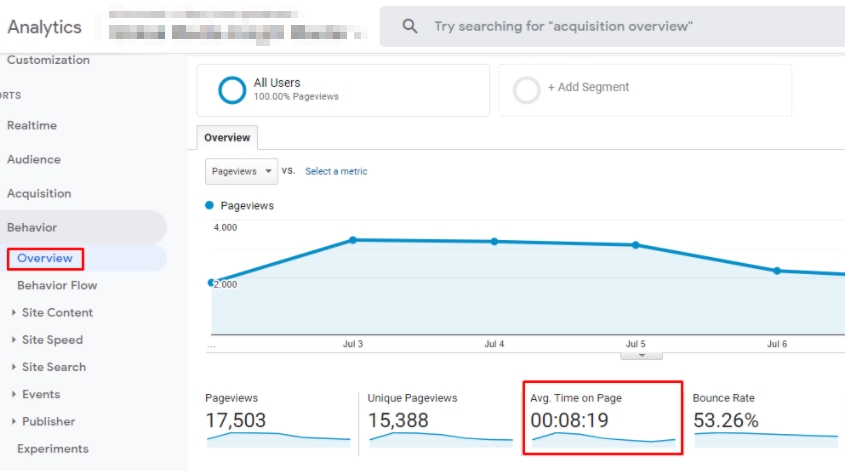
- Behavior Overview Report
Behavior > Overview report, which shows overall Avg. Time on Page of the website
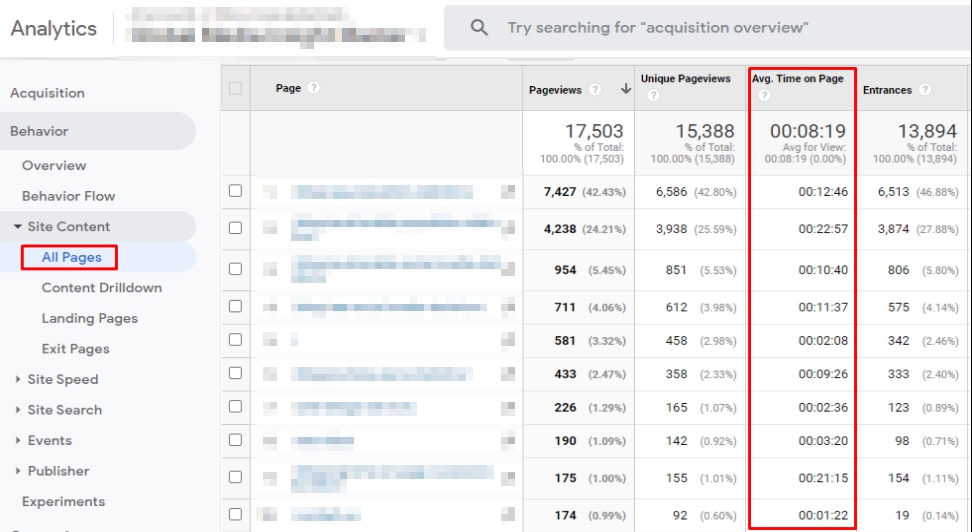
- All Pages Report
Behavior > Site Content > All Pages report, which shows Avg. Time on Page of each page
THE AVERAGES
Now that we are aware of the meanings of the terms “time-on-page” and “session duration,” let us move on to “average time-on-page” and “average session duration.”
Average Time on Page
What is Average Time On Page? It is used for measuring the average amount of time spent by all users on a single page of a website. It is restricted to the time spent on non-exit pages and does not include exit pages or bounces.
Average Time On Page Calculation Formula

Average Session Duration
Average Session Duration is used for measuring the average amount of time spent per session on a website. The total time spent across sessions is divided by the total number of sessions to get the result.
Average Session Duration Calculation Formula

Wondering Why the Average Session Duration is much less than the Average Time-on-Page?
While the time-on-page can never be greater than the session duration for a single session, we can often observe the opposite when considering the averages for multiple sessions. This is because we exclude the number of exits when calculating the average time-on-page, whereas all visits are taken into account for calculating the average session duration. Average session duration is the total duration of all sessions divided by the total number of sessions. It is important therefore to know properly how session duration is calculated.
This means that all of our 0-second sessions that were the result of bounced sessions will weigh down the average session duration across all of our sessions. As a result, the higher your bounce rate is, the lower your average session duration will be.
The Session Duration metric does not have the same capability to ignore the effect of exit pages. Every session has an exit page, and if there aren’t many pages in the visit, the loss of that last page timing can have a massive impact on the total. In the extreme case of a “bounce” visit that has only one page viewed, the Sessions count is 1, but the Session Duration is 0!
For this reason, using Average Session Duration as a key performance indicator is not recommended, as fluctuations in the number of pages viewed per session, the number of bounces, and the number of sessions can all influence the metric.
What’s the Difference between ‘Average Session Duration’ and ‘Time on Page’ in Google Analytics?
Google Analytics calculates average session duration by dividing the total duration of all sessions (in seconds) during a specified time frame by the total number of sessions during that same time frame. While the ‘time on page’ metrics measures the amount of time a user spends on a single page during a session.
The following example will help you to understand the metrics average session duration, average time on page and time on each pages.
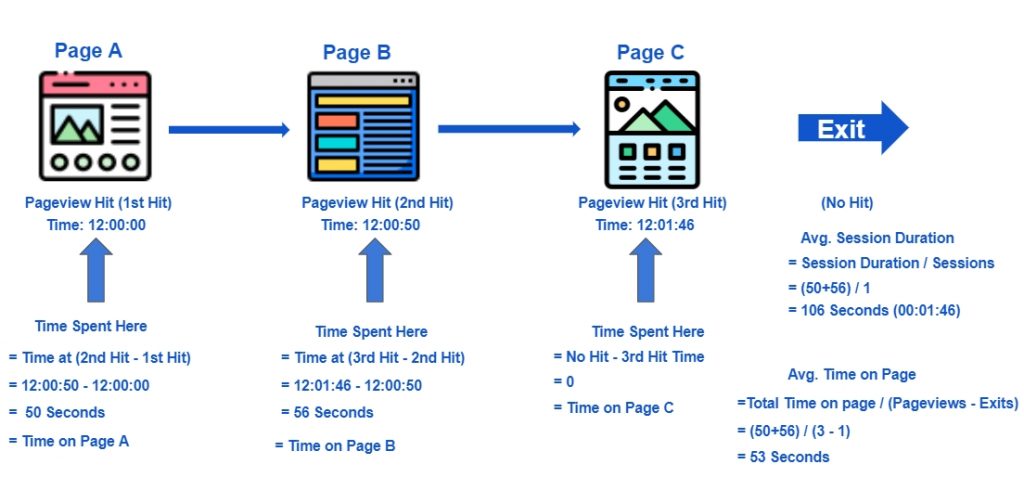
| Average Session Duration | 106 Seconds |
| Average Time On Page | 53 Seconds |
| Time On Page A | 50 Seconds |
| Time On Page B | 56 Seconds |
| Time On Page C | 0 |
How Is Session Duration & Time On Page Computed On A Single Page Visit?
The Total Session Duration is calculated as the time difference between the last interaction hit and the first interaction hit in a single session. In the below demonstrated scenario, the person exits without any hit, so the last interaction is zero.
The time-on-page is simply the time difference between the pageview hit of the next page to the current page. In this scenario, the time-on-page will be “0” seconds since the person did not go to any other page.
In short, session duration and time on the page will be zero seconds for single-page visits.
USE CASES
To better understand these terms, we have taken three different cases of how a visitor can interact with a website, illustrating the nuances of time on page vs session duration.
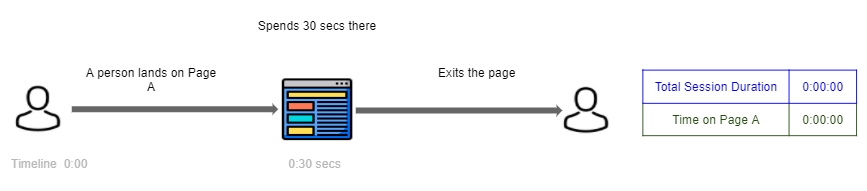
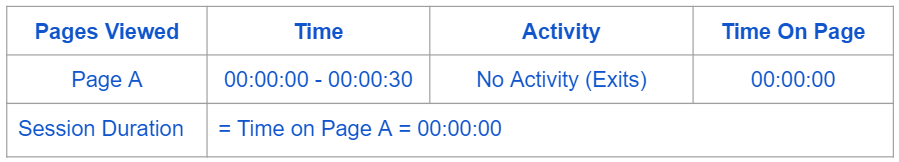
- Case 1
- A person lands on Page A
- Spends 30 secs there.
- Exits the page
The time-on-page and session duration will both be “0” secs since they did not go to any other page.
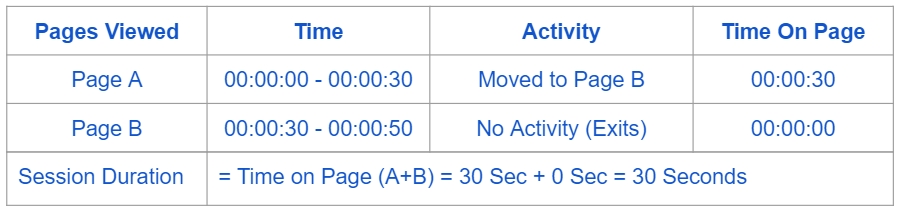
- Case 2
- A person lands on Page A
- Spends 30 secs there
- Clicks on a link to go to Page B
- Spends 20 secs there
- Exits the page
The time-on-page for Page A is 30 secs, and 0 secs for Page B. The total session duration is 30 + 0 = 30 secs.
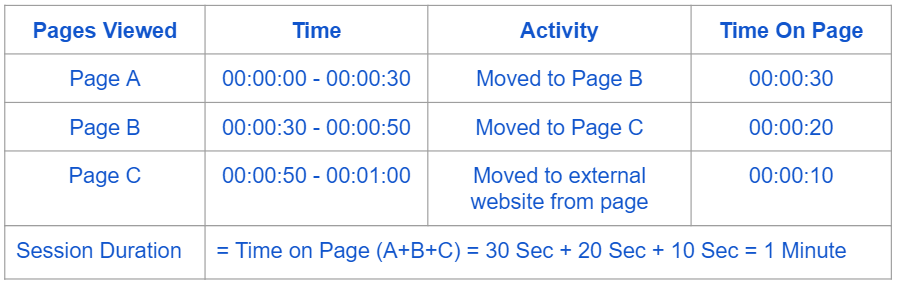
- Case 3
- A person lands on Page A
- Spends 30 seconds there
- Clicks on a link to go to Page B
- Spends 20 seconds there before going to Page C
- Spends 10 seconds on Page C
- He clicks on an external link on Page C to moves on to another website
The time-on-page for Page A is 30 secs, for Page B is 20 secs and for Page C is 10 secs. Since the user clicked on an external link on page C after spending 10 seconds there, it will be recognized as a hit rather than an exit. Clicks are viewed as interactive events. Since the last known interaction with the page is after 10 secs, the time-on-page for Page C will be 10 secs. The total session duration therefore is 1 minute (30 secs (Page A) + 20 secs (Page B) + 10 secs (Page C)).
FALLING SHORT
You’ll notice that two of the three cases we explored above don’t offer us an accurate picture of the time that our visitors spent on the website. This is true for both the time-on-page and the session duration. A person could spend 5 minutes on a page, and it would count for nothing if they were to exit directly from there.
Top 10 Tips to Improve Average Session Duration
An increased average session duration indicates an improved conversion rate and reduced bounce rate. Here are a few tips to improve the average session duration:
1. Interactive content
Interactive content such as videos, GIFs, infographics, calculators, quizzes, etc. helps to improve average session duration as they can hold user attention much more than texts. Videos and other interactive tools keep users on a page for at least a few minutes. And by reinforcing such content with a strong CTA, users can be encouraged to spend more time on your website.
2. Internal linking
When people are interested in a topic, they make an effort to know more about it. By strategically providing internal links to other content on the website, you can direct users to other pages, increasing session duration. Using compelling anchor text will prompt the users to click and explore.
3. Relevant titles
Clickbait titles are a common strategy content creators use to catch user attention. While it is a great idea, it often backfires if the content does not match the title. Users who take action after seeing an interesting title and are met with totally unrelated content will abandon the action. This leads to a high bounce rate vs low session duration. So, use relevant titles and give your users what you promise.
4. Quality copy
A copy should be simple and effective. Properly structured content with a clear introduction, subsections, small paragraphs, and common words helps create a good impression on readers. Good formatting is essential as most readers scan the content rather than read every word. Use punctuations, bullet points, and headers and create content that is easy to read.
5. Content updation
Updating old content, such as blogs with high traffic, can increase the session duration. For example, if your website has a 1000-word blog that drives traffic, by refreshing it and making it 2500 words, you will be able to keep your readers on the website for a longer duration.
6. Search intent
Understanding user search intent can help you create content that meets the requirements of your target audience. Identifying what people are searching for, how they land on your website, and what actions they take from there can help you figure out if your content is in alignment with users’ search intent. If it is not, the bounce rate will be high and session duration will be low.
7. Clean UI
A cluttered UI adversely affects the users’ focus and drives them to leave the website. Unnecessary imagery, difficult navigation, multiple ads, frequent pop ups, etc. will distract the user and cause them to abandon the website even if they find the content engaging.
8. Summary
A summary at the top of a page that describes the essence of an article in a few words can hook the readers. Getting an idea of what is included in the article right away motivates readers to stick and read through it. The summary helps to create interest and also gives the readers an idea about the uniqueness of an article.
9. Informational articles
Even though the internet is filled with information, investing in informational articles never fails. They help to build the credibility of your business. Moreover, most informational articles are lengthy, with an average read time of more than 5 minutes. Thus, it is a great way to enhance session duration.
10. Image links
Creating image links and directing users to a different page when they click on the image, from where they can get more information, is a proven tactic to improve session duration time. Moreover, if the image link is related to the products/services your business offers, it can also help to increase your sales.
Top 10 Ways to Improve Average Time On Page
The average time on the page is an indicator of the effectiveness of your website’s content. To improve the average time on page metrics, you can utilize some strategies, which we are going to discuss in this section.
1. Table of contents
A table of content helps users get a quick overview of the entire content and go directly to the section that speaks to them the most. This holds particularly true for lengthy articles. If readers have to strain to find a relevant section, they may not be interested and wouldn’t engage with the content.
2. Direct writing style
If the content is direct and straight to the point, there are more chances of people reading it. Jargons, fluff, and unstructured content will shoo away readers. Purposeful content with a natural tone and effective writing style improves the time on the page.
3. Open in new tab
By setting all links to open in a new tab, you avoid the risk of losing readers from a page whenever they click on a link. This means after exploring the new page, the reader will go back to the initial page as it will still be open on another tab. This will increase the average time on the page.
4. Exit intent
When a user leaves a website, using pop-ups will give users the chance to change their minds and continue browsing the website. It could be information regarding offers, discounts, subscriptions, etc. You can target abandoning users and retain them by properly using exit intent.
5. Unique data
Hooking readers with data is a well-used strategy by content creators. While it is a great tactic, most of the top-ranking pages for a keyword on Google have the same data. To make your content stand out, you can conduct your own research through surveys, polls, etc. and publish the unique data in your article. Thus people will spend enough time exploring your unique content.
6. Added value
Providing additional value with your blog posts such as presentation templates, checklists, etc. can help to keep people engaged. Tell the readers how they will find a bonus for them in the middle of the article or at the end. Chances are that they will read the article and interact with it.
7. Curious language
Talking to your readers in a language that inspires curiosity does wonder. Phrases like “Want to know an example?” or “What’s more” instills an interest in the readers, prompting them to continue reading. Creating a curiosity gap is a psychological trick that helps to maintain attention.
8. Actionable content
Creating content that provides step-by-step information towards taking action will really keep readers glued to the content. When you give users such detailed, actionable guidance, they get so much value out of it, so they spend more time on the page.
9. Multiple formats
When it comes to consuming content, people make different choices depending on the context. So, by providing content in multiple formats, you cater to all their needs, thus improving the time on the page. A blog post can also be offered as audio, video, and slides, and people can choose which format they want to consume.
10. Credibility
Users stay on websites they feel they can trust. To create this trust factor, you need to build credibility through your website content. This can be done by showcasing your story, client lists, awards, testimonials, etc. Providing social media profile links and human images (of team or clients) also plays a positive role in building credibility.
A COUPLE OF ALTERNATIVES TO MEASURE USER ENGAGEMENT
A key point we can derive from this is that marketers and businesses should stop focusing on just these time-based metrics to judge the performance of a page or a website. Thankfully, Google Analytics offers multiple alternatives that can provide a much better picture of a website’s performance. Let’s explore two of these below:
Hits
Google Analytics allows us to monitor a user’s actions on a page, like clicking a menu button, opening an accordion, etc. These can also be used to understand how the visitor interacts with the page and are a much more reliable measurement than time-on-page. This is shown in Case 3 above.
Virtual Pageview
Google Analytics offers us the provision to create custom events. Custom events can be used to set a trigger at a specific time point. If you have set your trigger for say, 1.30 mins, and the visitor was to stay on the page for 1.30 mins or more, it could be counted as a pageview. This is better known as a virtual pageview. Any time below 1.30 mins would be counted as zero, and any time above it would be counted only if you were to click a link on the page. This can be especially useful when you have specific conversion goals.
Bounce Rate
A “bounce” occurs when someone visits your website and leaves without interacting further with your site. Your bounce rate shows the percentage of your visitors who bounce off your site. By default, Google Analytics considers visitors to have interacted with your site if they visited at least one additional page. High bounce rates (when calculated correctly) are often symptoms of deeper problems like user experience issues or poor targeting.
Pages Per Session
Pages per session is the average number of pages a person views in a given session. This metric is calculated by dividing the number of pageviews by the total number of sessions. This metric can be helpful for gauging how sticky and engaging your website is. For example, if your website has an average page per session of 3, this means the average user visits three pages before leaving your website.
This metric is a standard option in Google Analytics that can be used to understand visitor behavior and optimize the site with the knowledge gained. Low page depth values are an indication of an information architecture that does not draw users far enough into the offer. But having a lot of page views does not necessarily mean that the information architecture is good. The decisive factor is what the website is supposed to achieve and whether readers can find what they are looking for.
We hope that we’ve helped you gain a better perspective of these terms and how they can be leveraged to better understand your website’s performance.
It’s important to note that even with their limitations, average time-on-page and average session-duration are not completely unreliable metrics. In fact, they can be fairly accurate if the exit rate is low. Further, when used as part of the whole spectrum of metrics available on Google Analytics, they can provide valuable insights towards improving a website’s performance.
Avg. time-on-page and session duration data helps you accurately identify the user engagement story of your website. It’s a valuable metric, as you can be aware of the value of your website content. After all, time is money! GMI has been offering result-oriented Google analytics consulting services for all kinds of businesses in the Middle East since the early 2000s. Give us a call now, and let us accelerate your growth.
From Data to Decisions: Why Partner with GMI for Google Analytics?
Choosing the right analytics partner is key to transforming website data into strategic business growth. GMI stands out by not only providing expertise in Google Analytics setup but also offering actionable insights into critical google analytics engagement metrics. By analysing average session duration and other website behaviors, GMI helps brands move beyond surface-level numbers to uncover what truly drives user interest and retention.
GMI’s consultants work closely with businesses to interpret complex patterns like user flow, bounce rates, and page engagement. This deep-dive approach ensures that every decision is backed by data—not guesswork. Their years of experience in the Middle East market means they understand regional user trends, allowing businesses to optimise content, navigation, and marketing campaigns for maximum ROI.
From tailored reporting to ongoing support, GMI’s commitment is to empower clients with knowledge and practical solutions. Their result-oriented insights help brands improve average session duration, reduce bounce rates, and elevate overall engagement. Partnering with GMI means making confident, data-driven decisions that keep brands ahead in a competitive digital landscape.
Frequently Asked Questions
What Are Sessions in Google Analytics?
A session refers to all the interactions that a user has with your website during a particular period of time. Whether he spends 2 seconds on a page or 2 hours browsing different pages of your website, it is considered one session. However, after 30 minutes of inactivity, the session ends and a new one begins.
What is a good average session duration?
According to contentsquare.com the average user spends 4 minutes and 24 seconds per visit across all industries and for databox.com, a reasonable benchmark for average session duration is between 2-3 minutes. A good average session duration might be anything above three minutes.
What is a good average time on page in Google Analytics?
According to Contentsquare’s 2020 Digital Experience Benchmark report of 20+ billion user sessions in 25+ different countries for 11+ industries, the Average Time on Page across industries is 62 seconds.
Why is the average session duration less than time on page?
This happens because 0-second sessions that were the result of bounced sessions will weigh down the average session duration across all of our sessions. This means that exit and bounce pages are excluded from the average session duration metric. As a result, the higher your bounce rate is, the lower your average session duration will be.
Why is the average session duration greater than time on page?
Average session duration could be greater than time on page if a non-bounce session starts on the landing page or if the session starts on a Page A and has more pageviews of page A.
What does it mean when your average session duration is zero in Google Analytics?
When your average session duration is zero, it simply means your visitors have only visited one URL on your website. It doesn’t imply they are not interested in your website at all. For example, if someone lands on any particular page of your website and then exits without clicking on any link or video, etc., then your average session duration will remain zero.
Which is more important: average time on page or session duration?
Neither metric is universally more important; both reveal unique insights. Average time on page shows engagement with specific content, while session duration reflects overall user engagement. The best practice is to analyze them together for a fuller picture of website performance.
How is AI improving the accuracy of average time on page calculations?
AI can detect patterns in user inactivity and exit behavior to better estimate time spent, even when visitors leave without triggering events. This leads to more precise measurements of average time on page for single-page sessions.
Can AI help identify misleading session duration data in analytics tools?
Yes. AI algorithms can flag unusual patterns—like high bounce rates or zero-duration sessions—and recommend corrections or further investigation, helping analysts spot misleading or inflated session duration data.
Does bounce rate affect session duration metrics?
Absolutely. A high bounce rate means more sessions with zero recorded duration, which lowers the average session duration in analytics. This is why it’s vital to track bounce rate alongside session metrics.
Is AI capable of predicting user behavior based on time-on-page trends?
AI systems can analyze time-on-page patterns to forecast future user actions—such as predicting which content keeps visitors engaged or at risk of exit—supporting personalized content and site improvements.


